


The data we use to follow the COVID-19 pandemic in the United States is unwieldy. Cases alone are only a partial indicator of the severity of regional outbreaks. More testing discovers more cases, so we have to look at test positivity to see if testing results indicate worsening outbreaks. (In a recent post, we explored how tests-per-positive may be a more useful indicator than the percent-positive rate—we use both.) Some media accounts treat deaths as the ultimate measure of whether a state’s response is succeeding or failing, but it takes a long time to die of COVID-19—nearly three weeks from the date of infection, on average, and another week beyond that for the states to report the deaths. This means that reported death numbers are often a measure of an outbreak’s severity up to a month in the past.

And deaths aren’t the only profound outcome of COVID-19. We don’t yet know the long-term effects of surviving COVID-19, but there’s evidence it could cause permanent lung damage, diabetes, and brain damage. Science writer Ed Yong spoke with several survivors who experienced symptoms weeks and months after contracting COVID-19. None of the people Yong profiled were admitted to an ICU, and their collective experiences revealed that some so-called “mild” cases of COVID-19 can be “hellish,” with lingering symptoms that include shortness of breath, hallucinations, delirium, even feelings of a heart attack despite normal EKG readings.
That’s what makes the number of COVID-19 hospitalizations such a useful data point. It complements case counts because it’s a measure of severity, conveying COVID-19’s effects on both people and healthcare systems. Like every other COVID-19 metric, hospitalization data has a built-in lag—when someone contracts COVID-19 and is eventually admitted to the hospital, it takes about six days after infection for them to begin to feel symptoms, and another week before they’re admitted. Still, this means that hospitalizations may be almost two weeks ahead of reported deaths as a way for us to understand outbreaks.
And while we won’t know what effect non-fatal cases of COVID-19 will have on survivors, health insurance, or healthcare for months, or even years and decades, today’s hospitalization numbers are a place to begin for tomorrow’s planning. In short, it’s a number that sits at the center of a lot of what we want to know about the pandemic and its effects.
Hospitalization and the mysteries of the COVID-19 death curve
In the shorter term, hospitalizations can help us predict whether the death curve in the United States, which has been declining for months, will begin to increase or plateau. A systematic review of 14 studies published in the Journal of Medical Virology found that across the studies, about a quarter of hospitalized patients died. In an early study of 5,700 hospitalized patients in New York City, the mortality rate among the 2,634 with known outcomes was 21 percent. A smaller study in the Bronx borough of New York City found a 24 percent in-hospital mortality rate.
Many US states are showing COVID-19 hospitalization increases—some quite sharp—so these are worrisome numbers.

But there’s reason to hope that hospital mortality rates are declining. That’s the news from Milan, where hospital fatality rates fell from 24 percent to 2 percent from March to May (and the percentage of hospitalized patients who needed to be admitted to intensive care units also dropped). In England, the hospital fatality rate fell from 6 percent in April to 1.5 percent in June.
Researchers have suggested a variety of reasons for this decline in hospital deaths. The authors of the Milan paper suggested several factors, including a better understanding of the disease’s effects, a reduction in the severity of the local outbreak, and a decline in simultaneous infections with seasonal illnesses. “Patients with COVID-19 in late March and early April included a significant proportion of patients who caught the infection in hospital,” the authors of the British Medical Journal report on the decline in hospital mortality rate in England wrote. “These patients, because they were in hospital, were more likely to be sicker and more vulnerable than patients who acquired infection in the community and so more likely to die from COVID-19.”
But as the share of patients with infections from community transmission increases, the mortality rate has still declined. Several factors might explain this: Current patients are younger and less likely to die, hospitals are admitting less severe cases because more beds are available, and doctors and nurses have learned from experience. Bob Wachter, chair of the University of California-San Francisco Department of Medicine, posted a list of “Things We’ve Gotten Better At Since March”; it includes a number of improvements that could affect in-hospital mortality, such as better monitoring of vital signs and a more effective use of prone (face-down) positioning, which has been observed to improve oxygen levels in severely ill COVID-19 patients.
We still don’t know how the death curve will respond to increasing hospitalizations in the United States. In certain states, the rise in hospitalizations has been very sharp. Between June 2 and July 2 in Arizona, the number of people hospitalized with COVID-19 rose from 1009 to 2,938. During the same period in California, COVID-19 hospitalizations rose from 4,393 to 6,812. For the same dates In Texas, COVID-19 hospitalizations jumped from 1,773 to 7,382.

(Note: Case fatality rates are a useful metric, but can be biased toward higher death rates, since the most severe cases tend to get tested. This is especially true for fatality rates within hospitals. They should not be translated directly to the overall fatality rate of COVID-19.)
The patchy history of US COVID-19 hospitalization data
In the early months of the pandemic, it was impossible to know how many people in the United States were hospitalized with COVID-19. On April 5th, when we began compiling hospitalization data, only 13 states reported how many people were in the hospital with COVID-19. Twenty-five other states reported the cumulative number of people who had been hospitalized.
Current hospitalization numbers go up when COVID-19 patients are admitted or when already admitted patients are diagnosed with COVID-19, and down when COVID-19 patients die or are released from the hospital, or when patients considered to be probable cases receive negative confirmatory test results. Cumulative hospitalization numbers are intended to capture all COVID-19 patients admitted to hospitals, but this number also changes as patients are diagnosed with COVID-19, or when probable cases of COVID-19 are ruled out by negative confirmatory test results.
Because the two hospitalization metrics are fundamentally different kinds of quantities, we could not merge them into a single number that answered the most pressing question: how many people were in the hospital with COVID-19?
More than two months from when we started compiling hospitalization data, 47 states, 2 territories, and the District of Columbia now report the number of people currently hospitalized. This has allowed us to create useful national summary statistics about this crucial metric of disease severity.
One state with worrying case and test positivity trends that doesn’t show up in the hospitalization data is Florida. Its seven-day average for daily new case counts was under 1,000 at the beginning of June; by July 2, the average was over 7,800. Test positivity rose from 5.5 percent in the first week of June to 16.6 percent in the last week. Given those trends, hospitalizations would be expected to climb—but the state hasn’t reported COVID-19–specific hospitalization data except in a single week in May.
Hawaii, Idaho, and Kansas also don’t report how many COVID-19 patients are currently hospitalized, but none are as populous as Florida. While case counts are rising in Idaho and Kansas, the case counts are lower and the rise in new cases is still shallower than in Florida.

The South Florida Sun-Sentinel tracked down hospitalization data from three counties in its region that runs through June 24. As of that date, Miami-Dade County had 981 hospitalized COVID-19 patients, a high since April and up from 787 since June 1. Hospitalizations in Broward County doubled in that timeframe; they were up from 245 to 394 in Palm Beach County. Those are the three largest counties in Florida. In Hillsborough, the fourth-largest, hospitalized patients increased from 196 to 267 from June 18-25 (as positive cases rose 61 percent to over 7,000). In the fifth-largest, Orange County, the Orlando Sentinel reports that 185 patients were hospitalized on June 26. That’s up from 73 on June 15, and a low of 27 on May 10.
Estimating the true extent of COVID-19 hospitalizations in the US
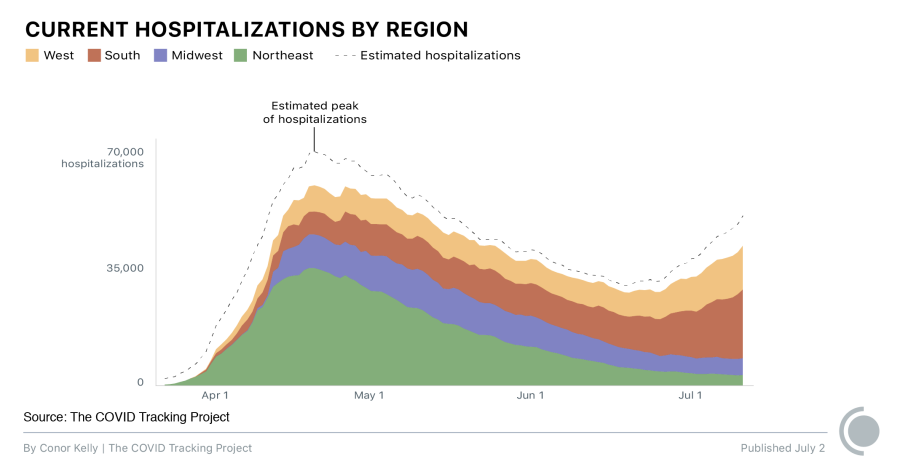
Because Florida isn’t reporting statewide totals, our regional hospitalization data for the South is considerably lower than the true count. And even without Florida, the trends there are the worst of any US region. The chart below shows estimates of the true hospitalization count for each region with non-reporting states included; the trend in the South is the same with and without Florida’s estimate. COVID-19 hospitalizations in the West are also rising, though not as drastically.

To derive the estimates in the chart, we take the number of cases reported in a given region over the prior two weeks and calculate the share of those cases that came from states that are not reporting current COVID-19 hospitalizations. We then estimate current hospitalizations for non-reporting states, so that these states have hospitalization estimates proportional to their share of cases. For these states, we assume that the relationship between new cases and hospitalizations is the same as the region as a whole.

As the chart shows, the national COVID-19 death curve has been closely related to the hospitalization curve until early June. But there’s no reason to think deaths won’t go up again in regions and states where hospitalizations are currently increasing, especially in places where COVID-19 hospitalizations have risen sharply, like Arizona and Texas. What remains to be seen is how steeply death counts will rise. It’s possible the rise in deaths will not be as dramatic, given the changing demographics of the infected, the precedent of Milan and England, and lessons learned about treatment since the beginning of the pandemic. But even if a greater percentage of hospitalized COVID-19 patients survive, they could face considerable health problems that we still know very little about.
Note: As of July 2, 47 states and the District of Columbia reported hospitalizations. FL, HI, KS, AS, GU, PR, and MP do not report it. Hospitalization estimates included in the graphics are based on the percentage of all new reported cases over the previous two weeks that occurred in states reporting hospitalization data, compared to those that did not.

Whet Moser is a freelance writer in Chicago.

Conor Kelly is the director of data analytics at Hanover Research.
More “Hospitalization and Death Data” posts
20,000 Hours of Data Entry: Why We Didn’t Automate Our Data Collection
Looking back on a year of collecting COVID-19 data, here’s a summary of the tools we automated to make our data entry smoother and why we ultimately relied on manual data collection.

A Wrap-Up: The Five Major Metrics of COVID-19 Data
As The COVID Tracking Project comes to a close, here’s a summary of how states reported data on the five major COVID-19 metrics we tracked—tests, cases, deaths, hospitalizations, and recoveries—and how reporting complexities shaped the data.


How Lagging Death Counts Muddled Our View of the COVID-19 Pandemic
During the worst parts of the COVID-19 pandemic, the United States struggled to keep up with COVID-19 death counts.