


The COVID-19 hospitalization dataset published by the US Department of Health and Human Services (HHS) provides a comprehensive look over time at the state of COVID-19 hospitalizations within the United States. The dataset includes many hospital capacity and usage metrics, including, for example, the current number of adult and pediatric patients who are suspected or confirmed to have COVID-19 hospitalized in inpatient and intensive care unit (ICU) beds. Each of these metrics are reported by every US hospital every day, with the exception of psychiatric and rehabilitation hospitals, which report weekly. More than 6,000 hospitals report to HHS either directly or via their state or state hospital associations, and the underlying dataset is publicly accessible and used across federal and state agencies: The CDC uses this hospitalization data in their COVID-19 Data Tracker, and it is included in the publicly available Community Profile Reports and State Profile Reports. HealthData.gov, a public repository of government health datasets, contains various “slices” of the dataset, including state- and facility-level measures over time.

Since the dataset’s public release in various stages from July to December, The COVID Tracking Project has conducted a series of analyses that found that the data is now remarkably close to our own estimates. After adjusting for variations in definitions and reporting lags, the HHS data for current COVID-19 hospitalizations nationwide is usually within a few percentage points of the data we compile from state dashboards.

One of the greatest advantages of the HHS data is the standardization across states and hospital facilities of which metrics are collected and how they are defined—something that our dataset lacks. This standardization includes the separation of confirmed and suspected COVID-19 cases within both inpatient and ICU stays. The HHS data also includes COVID-19 admissions—again separated by confirmed and suspected COVID-19—which is broken down further in the facility-level dataset by 10-year age brackets. It also includes how many hospitals are reporting staffing shortages today and within a week. Further, the facility-level granularity present in the HHS data allows us to evaluate trends occurring at each hospital and on various geographic levels, including by hospital service area and hospital referral region.
Where to get the data
The HHS data can be viewed in multiple locations, including the CDC COVID-19 Data Tracker, which aggregates the data to county-level “hospital utilization” metrics like new admissions and percentage of staffed beds used by COVID-19 patients. The HHS Protect Public Data Hub page on hospital utilization provides a searchable map of hospital utilization by facility, dashboards of inpatient and ICU bed utilization by state. We have also created an interactive map that provides searchable information from the HHS facility-level dataset on all inpatient and ICU COVID-19 patients currently hospitalized in each hospital facility in the latest reporting week.
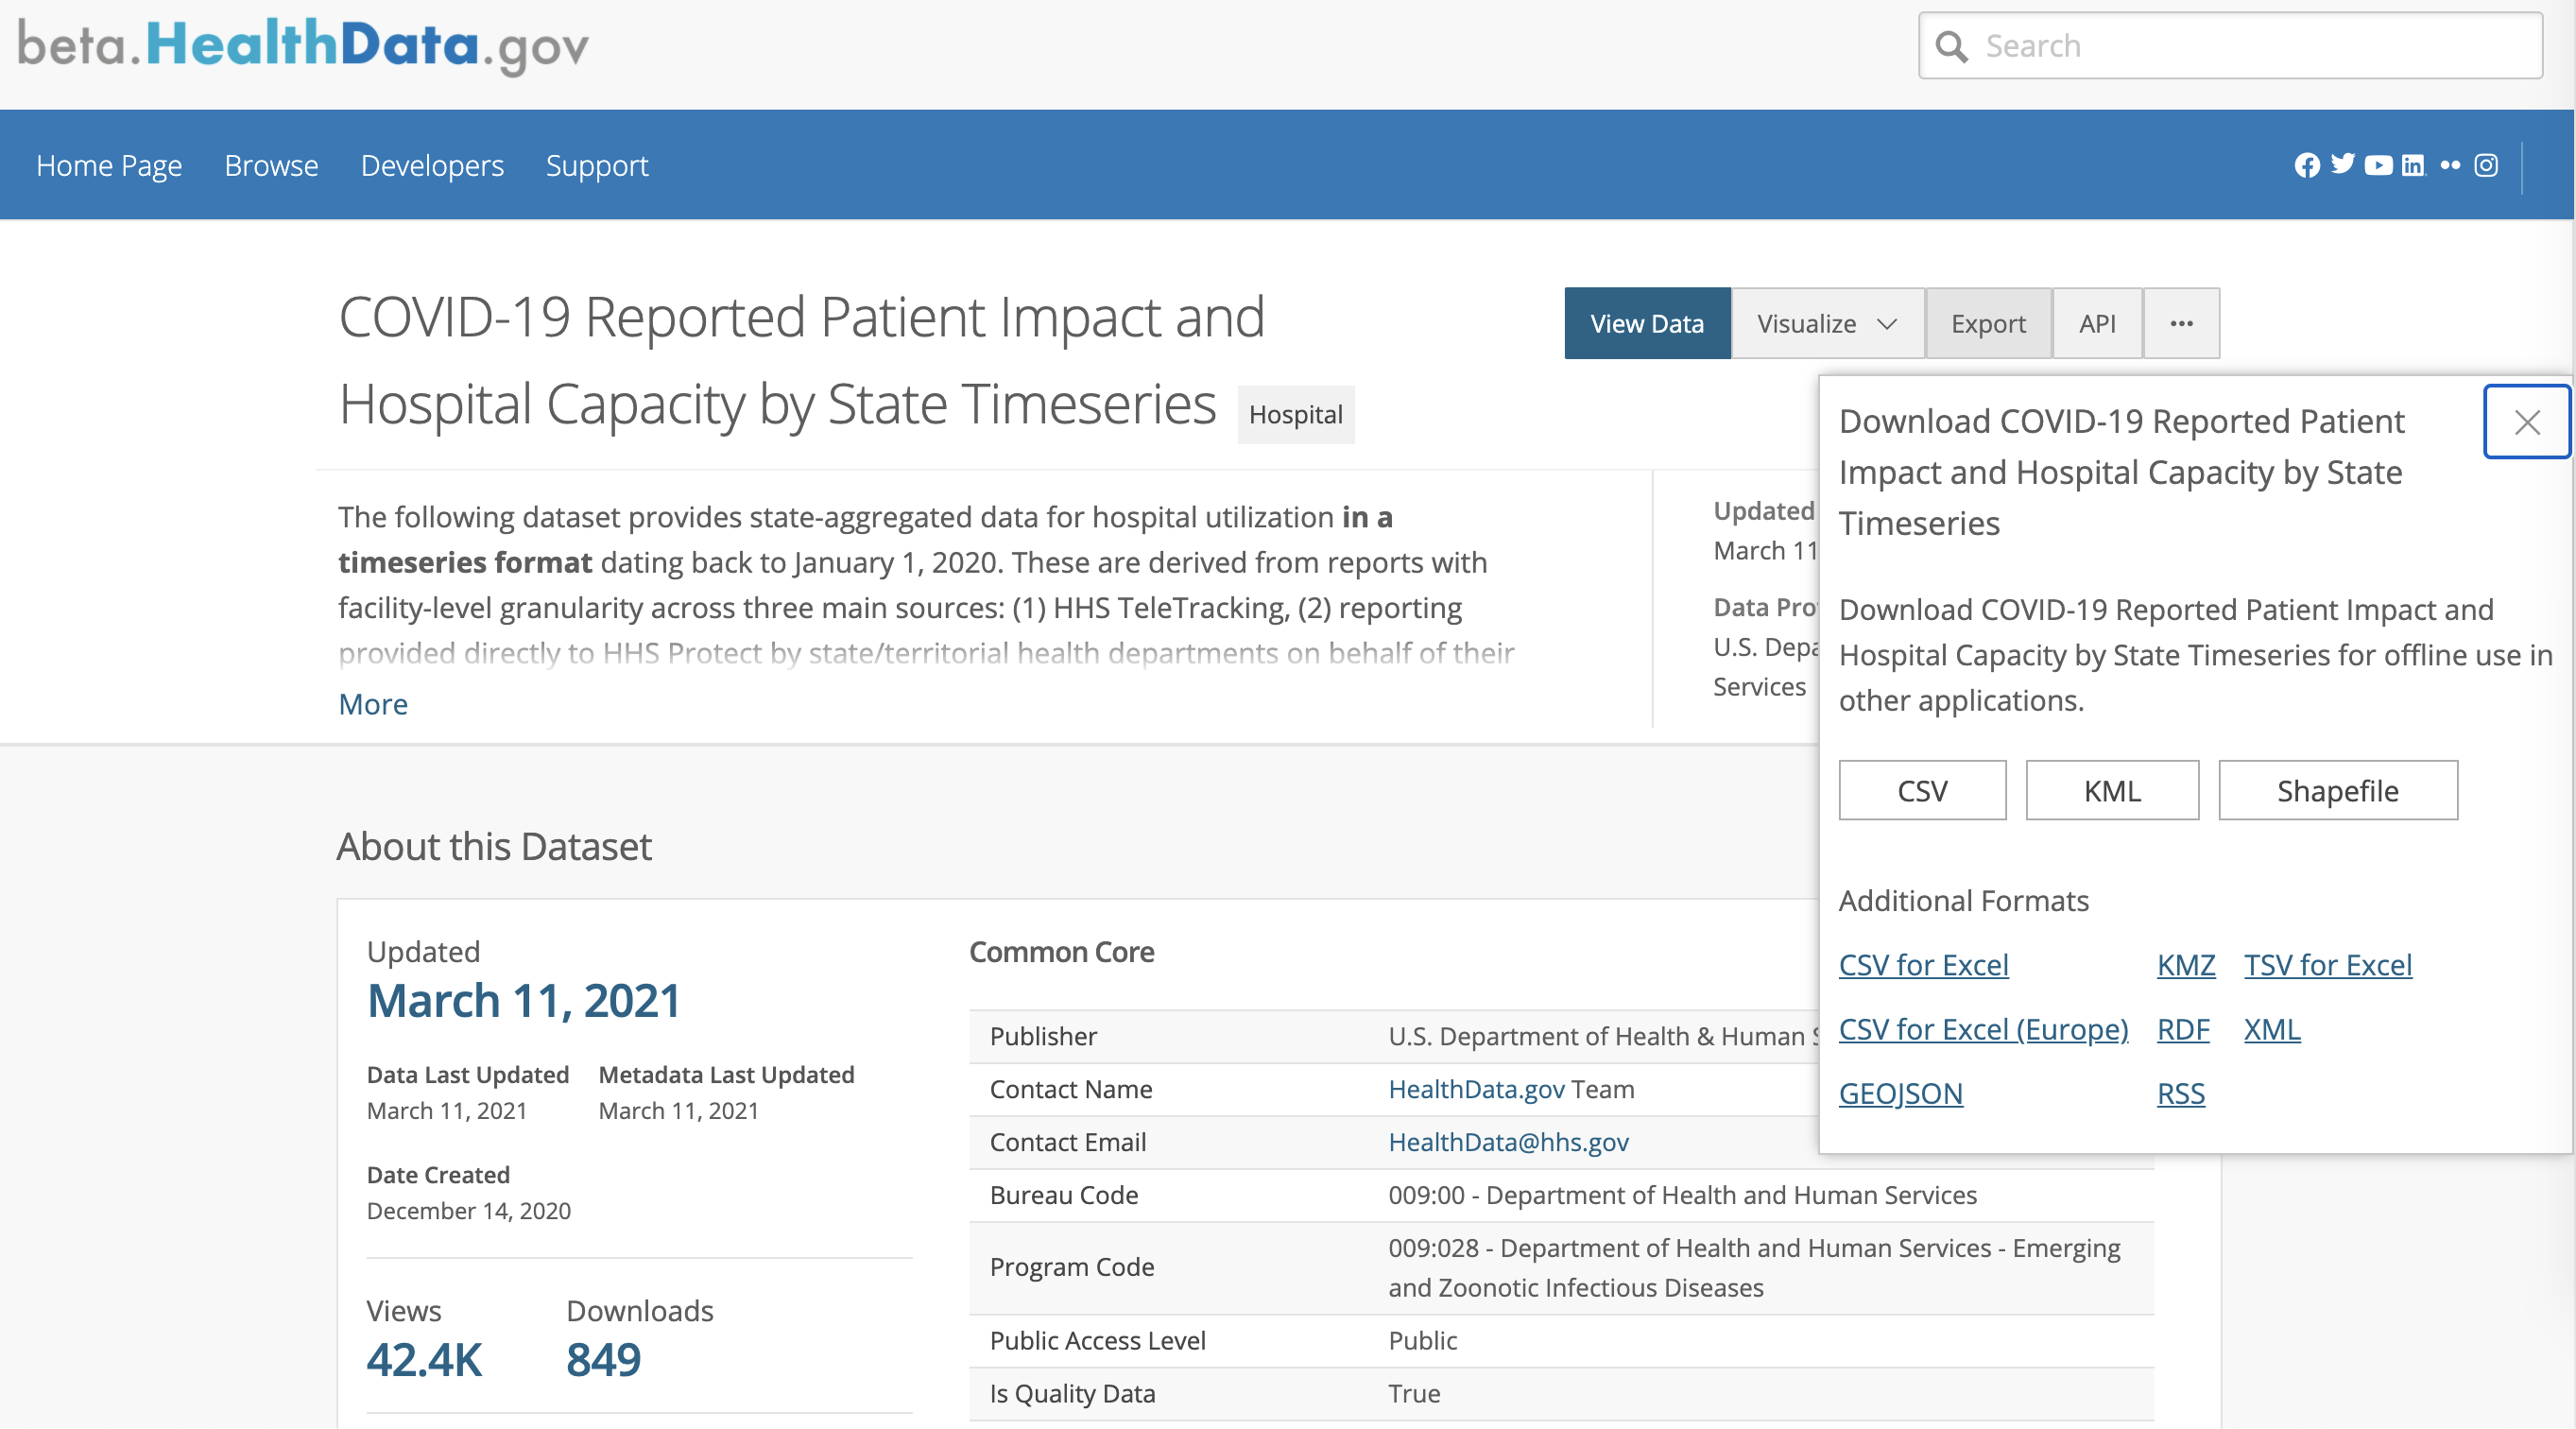
The “raw” data is also publicly available for download at HealthData.gov, but analysis may require additional data analysis tools (such as Excel or Google Sheets or a statistical programming language) given the size of the dataset (over 18,000 rows and 60 columns for the state-level time series data and over 130,000 rows and 90 columns for the facility-level time series data).
These screenshots show how to access the data housed at HealthData.gov. For the state-level hospitalization time series, data users should check the update date and time for the data, and use the button labeled “Export” to get a CSV file or explore the data directly on the site using the “View Data” or “Visualize” options.
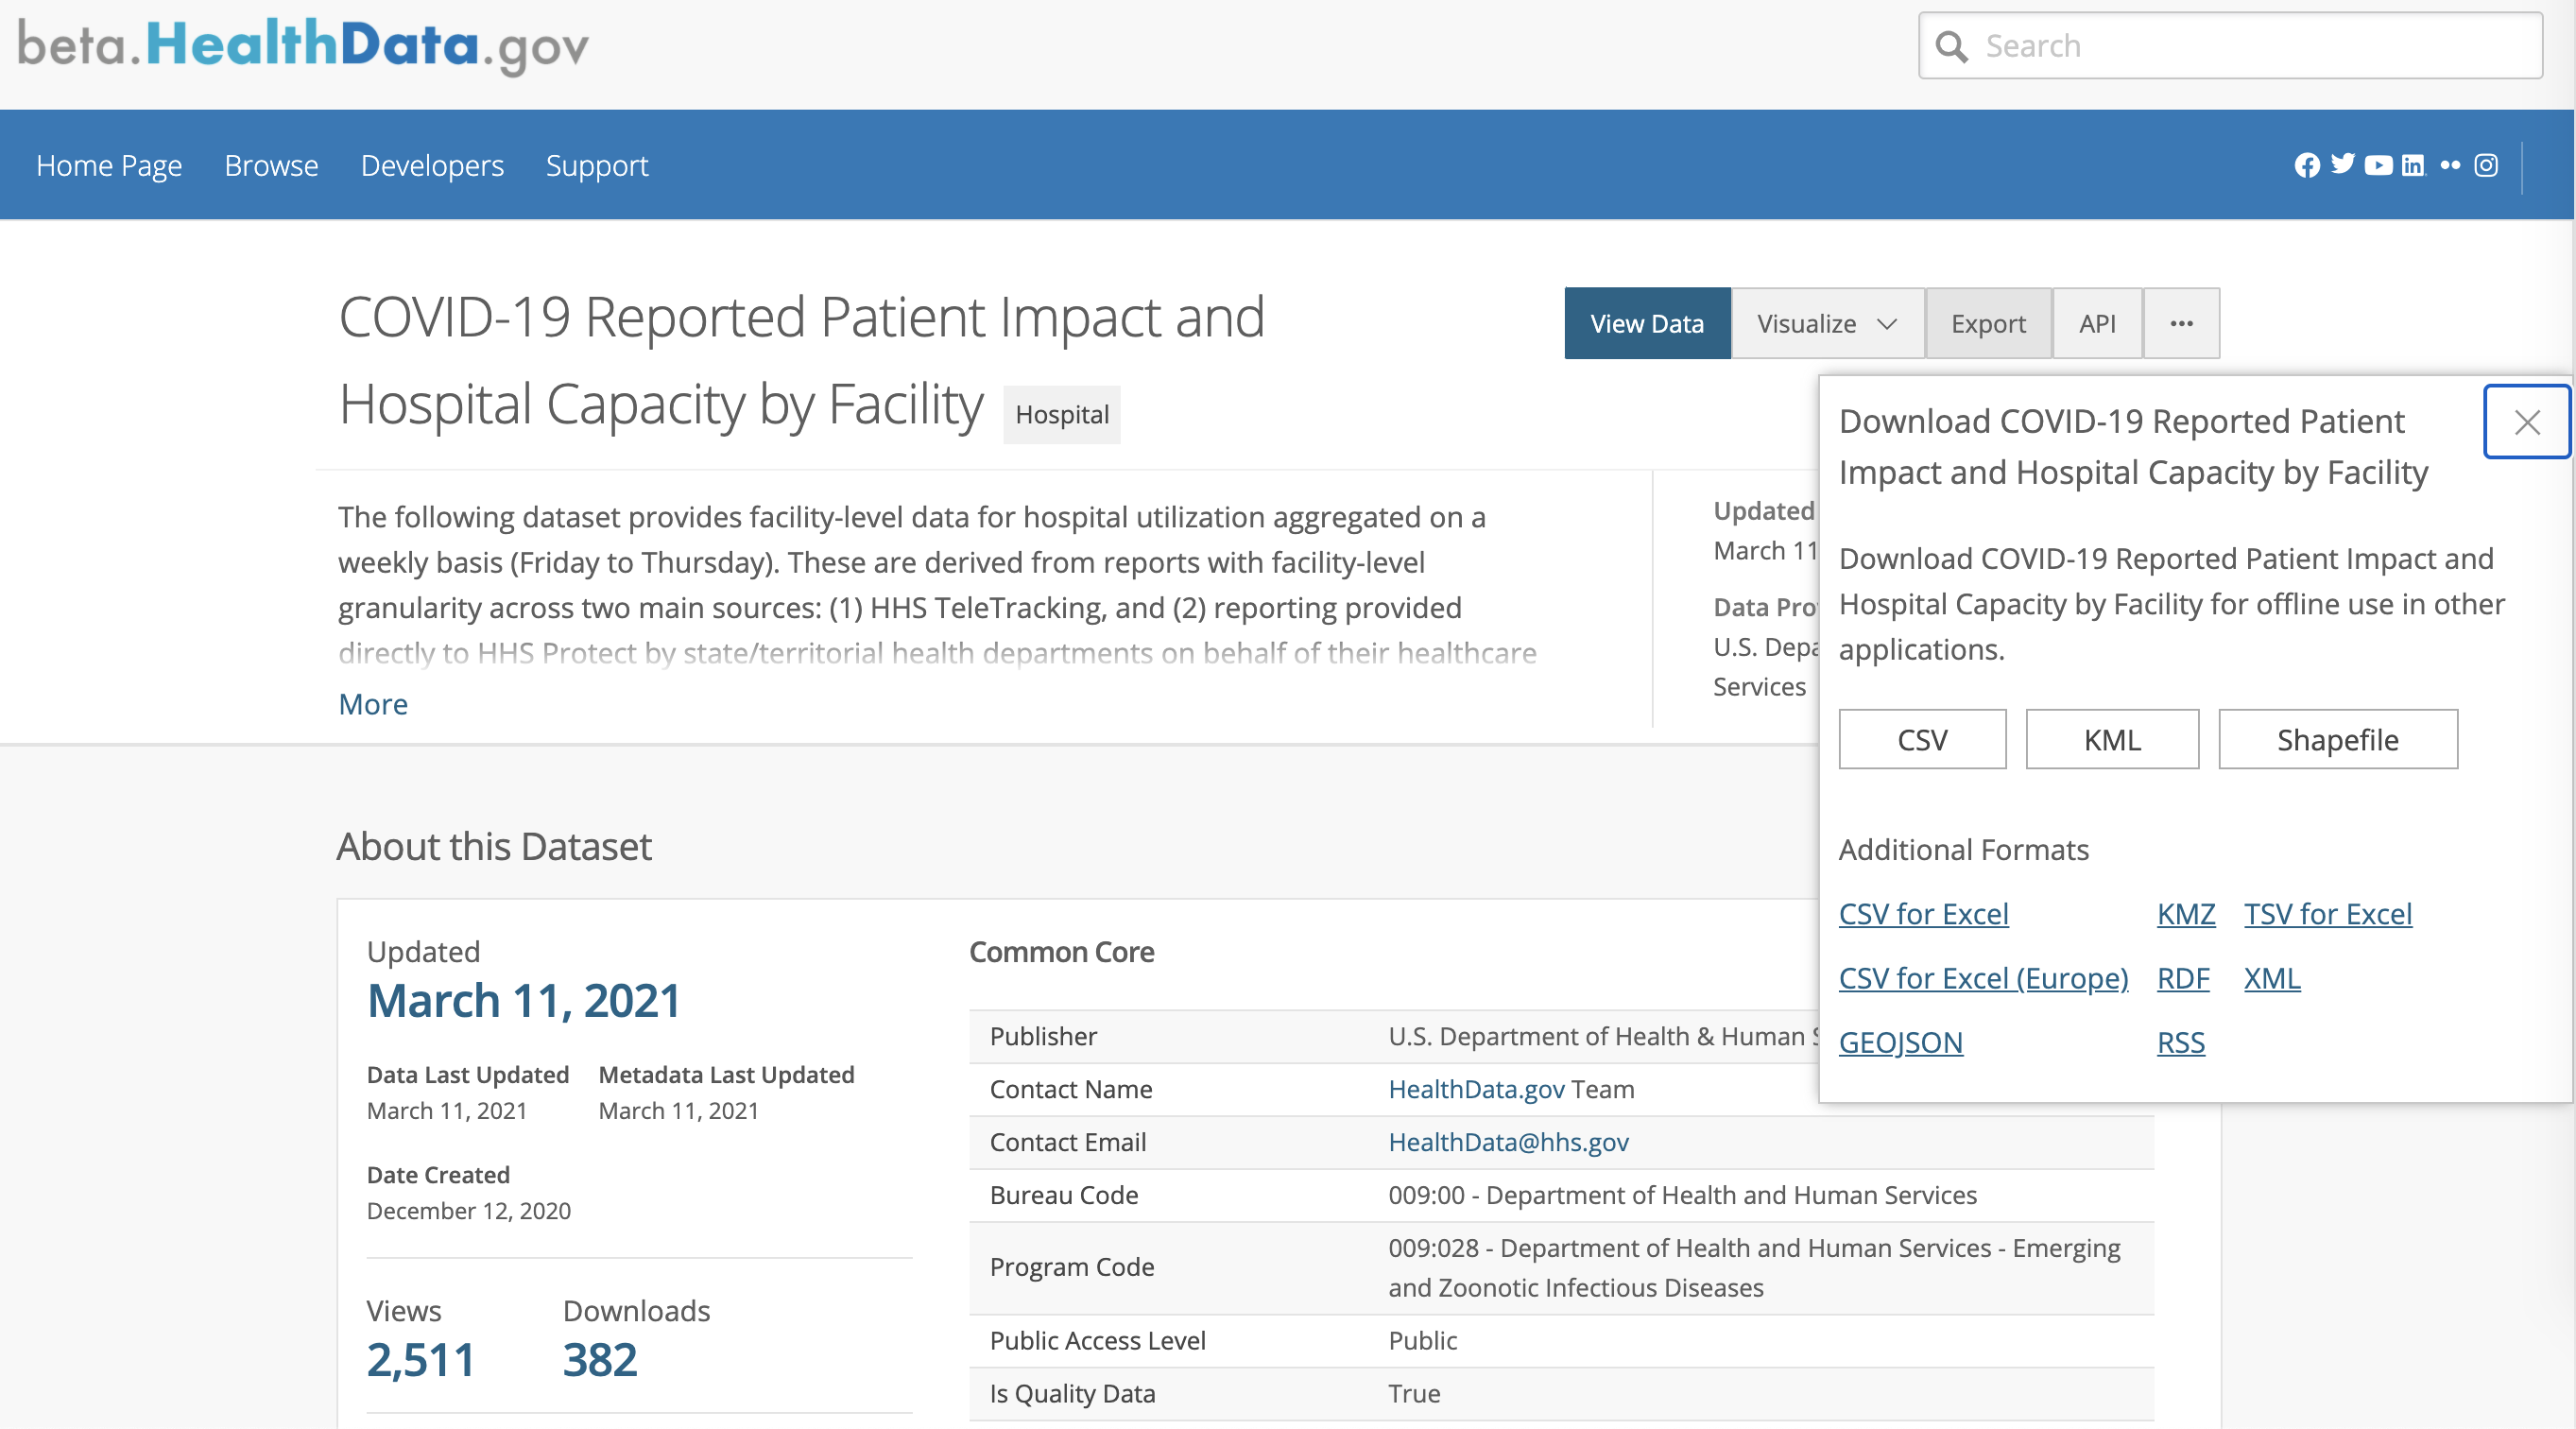
For the facility-level hospitalization time series, we recommend carefully reading the data element descriptions on the download page and then following the same process of verifying the update date and time and using the “Export” button to get the relevant CSV file.
Notes on using the data
In the state-level data, each row corresponds to one state for one day going back to March 2020; the data is updated regularly on Mondays, and prior updates and tracking of revisions (such as backfills and corrections) are available on the corresponding archive repository page. In the facility-level data, each row represents one facility’s daily reported data averaged for each “collection” week, which spans Friday through Thursday going back to August 2020. This data also updates on Mondays and prior updates are available at the corresponding archive repository page.
Although the hospitalization data in the state-level time series goes back to March 2020, it started to become significantly more complete and broader in scope starting July 15, 2020, when the hospital data reporting system switched to HHS Protect. Shortly after this switch, hospital reporting on the majority of data fields also became mandatory. Data before July 15, 2020 came from the prior reporting system (CDC’s National Healthcare Safety Network system) and was voluntarily reported by hospitals. We advise caution when interpreting hospitalization data trends from earlier in the pandemic when hospital reporting was less complete. See the HHS Protect Public Data Hub page on hospital reporting for details on the current completeness of hospitalization data to the individual facility-level and how this reporting has improved over time.
In addition to the state-level time series which updates weekly, provisional daily updates of hospitalizations at the state-level can be found in a separate data page (and archive repository) at HealthData.gov. This daily update file provides the same data fields as the state-level time series but solely for the most recent date of data available. Each update to this file is a new snapshot of state-level hospitalization metrics at that time of update. Be cautious in interpreting large changes seen in these daily updates which may be due to incomplete or anomalous reporting. These errors are often corrected later on in the weekly update to the time series file.
In the facility-level data, to protect patient privacy, values between 0 and 4 have been replaced with -999999, so caution should be taken to preprocess the data to appropriately summarize and calculate values. Further, facilities that do not report every day, as well as facilities operated by the Defense Health Agency, Veterans Affairs, and Indian Health Service, are not included within the facility-level data. Due to this being a smaller subset of facilities, weekly averaging of reported daily numbers, and replacement of 0-4 values by -999999, summing up the facility-level data will not exactly match the totals in the state-level dataset.
There are many helpful resources available to answer questions on the data, including the HHS’s hospital reporting FAQ, individual data dictionaries for the state-level and facility-level time series data, and even a community-created FAQ for the facility-level data on Github.
The hospitalization dataset is great—and could be even better
The HHS hospitalization data has been instrumental in communicating the state of the pandemic at a granular level. We think a few changes would strengthen the data even further. Our top suggestion for the HHS team would be to improve access to the dataset via an API that includes paginated results and the ability to query in order to obtain more specific, smaller segments of the overall dataset. This is especially important as the dataset continues to grow with each day and week’s additional rows, and its successful implementation could enhance accessibility and reproducibility of future analyses. (Update on 3/11/2021: These improvements are currently in development with the dataset migration to beta.HealthData.gov. This new site runs on the Socrata data platform, which provides SQL-like querying features and an API.)
A smaller but important improvement would be to provide an option to download only one state’s data at a time, which could help to facilitate localized analysis. It would also be helpful to have all the data elements that appear in the facility-level data also present in the state-level data. For example, COVID admissions are broken out by age bracket in the facility-level but not in the state-level time series.
We believe that in its current state the data provides a critical resource for public health researchers, journalists, and policymakers alike, which will be enhanced as the dataset is improved and additional metrics are made public. Daily status reports from every hospital across the nation provides us with a uniquely reliable and fine-grained signal of how our health systems and communities are faring in the pandemic.
3/11/2021: We have updated this piece with links and images to the new beta.HealthData.gov data hosting pages and more details about the hospitalization datasets available.

Dave Luo has an MD/MBA and is a Data Science and Data Viz lead at The COVID Tracking Project.

Catherine Pollack is a third year PhD candidate in the Quantitative Biomedical Sciences program at Dartmouth College. Her dissertation research combines data science, epidemiology, and public policy to combat online health misinformation.
More “Federal COVID Data 101” posts
Federal COVID-19 Testing Data Is Getting Better
The federal government improved its state and county-level COVID-19 PCR testing data since we analyzed it in February. Here’s an update on those changes and what we hope to see next for the data.

Federal COVID Data 101: What We Know About Race and Ethnicity Data
Publicly available federal race and ethnicity COVID-19 data is currently usable and improving, although it shares many of the problems we’ve found in state-reported data.

How Not to Interpret COVID-19 Data
Beware of dating schemes, data dumps, weather events and other issues that can lead to mistakes that confuse the public.

