


COVID-19 cases dropped about 5 percent this week, while testing rose 12 percent as backlogs in reported tests—always a little slower to recover than reported cases—rolled in following disruptive mid-February storms. The number of people hospitalized with COVID-19 dropped almost 16 percent week over week, chalking up the seventh straight week of sharp declines in hospitalizations. States and territories reported 12,927 deaths this week, including a substantial backlog from the Commonwealth of Virginia.

The decline in cases has been a point of confusion in the past week, as daily reports briefly jogged up after a large drop following President’s Day and disruptive winter storms in mid-February. A look at percentage change in reported cases since November 1 helps illustrate the dips and rises in reported cases seen around Thanksgiving, Christmas, and New Year’s Day, and—more recently—the winter storms in mid-February. (On November 8, California did not report data in time to be included in our daily compilation.) Cases may plateau or rise at any point, and a close watch on the numbers is essential as vaccinations roll out alongside the spread of variants of SARS-CoV-2. But we would urge data watchers to be wary of conflating reporting artifacts with real changes in the state of the pandemic.

Although it seems unlikely based on current figures that a new surge is showing up in the case numbers, it is quite possible that case declines are beginning to slow. With reported tests up 12 percent this week—likely also because of a storm-related dip and rise—it’s impossible to be certain whether the case decline is slowing because of an increase in testing, or because disease prevalence itself is declining, albeit more slowly. We can look to other metrics, however, to help us interpret the past two weeks of case numbers.
One way to confirm that a change in reported cases—especially one preceded by a disruptive event like a holiday or major storm—reflects reality is to look at new hospital admissions. This metric, which is available in the federal hospital dataset, has tracked very closely with cases since the hospital dataset stabilized last fall, but has not shown the same vulnerability to reporting disruptions produced by holidays or severe weather. Charting federal case data against new admissions data shows that the decline in new admissions continues, though slightly more slowly than the decline in cases.

This signal helps confirm that the brief rise in daily reported cases in the past week was very unlikely to signal a new surge in cases—though, again, cases may not be dropping as quickly as they were in late January and early February. It’s nevertheless important to note that cases still remain extremely high, and have only this week dipped below the peak of the summer’s case surge. (Though we’re almost certainly detecting a larger percentage of cases now than we were in the summer, as our testing capacity in the US has increased.) The sustained decline in cases and hospitalizations is very encouraging, but with multiple variants of SARS-CoV-2 gaining footholds in US cities, it remains vitally important to further reduce the virus’s spread via masking, social distancing, and avoiding indoor gatherings.
While it may seem that the decline in hospitalizations is slowing down in recent weeks, the percentage decrease remains robust.

Reported COVID-19 deaths, too, continue to decline. The particularly sharp drop in the week beginning February 11, which included President’s Day and the beginning of the winter storms that affected data reporting in many states, was balanced by a smaller drop in the week of February 18. This week, deaths dropped by an encouraging 11 percent.

It’s important to note that many states have recently added large numbers of COVID-19 deaths from previous months to their totals. In Virginia, cases and hospitalizations have been dropping for weeks, but after reporting fewer than 100 deaths per day for the entirety of the pandemic up to this week, the Commonwealth is now reporting hundreds of deaths each day—most of which occurred in December and January.

The addition of these backlogged deaths—like the 4,000 deaths from previous months recently reported by Ohio—obscures the reality of rapidly declining recent deaths. They also underline the fact that deaths at the peak of the winter surge were actually much higher than the already devastating numbers reported in December and January.
For the week ending February 25, COVID-19 deaths in long-term-care facilities have continued to decline as a share of all COVID-19 deaths in the US. (As we did in last week’s analysis, we have excluded from this chart all data for four states—Indiana, Missouri, New York, and Ohio—that recently added large numbers of un-dated deaths from previous months to their totals. The addition of these historical death figures to recent weeks made it impossible to follow recent trends at the national level without this exclusion.)

Passing the baton to the federal government
It’s our final week of compiling and interpreting data here at The COVID Tracking Project, and we’ve spent much of the past few weeks explaining how to use data from the federal government in places of our patchwork dataset. We’ve packaged up everything we’ve learned about federal case numbers, death numbers, hospitalization data, and testing data, as well as long-term-care data. For more casual data users, we’ve also written a short primer on how to find easy-to-use charts and metrics from the CDC. It’s even possible to replicate three quarters of our daily four-up topline chart using data from the CDC, although the data is one day behind the state-reported data we compile.

In this version, new hospital admissions are included instead of tests—test data is available from the federal government, but are not in a date-of-report arrangement that matches the other topline metrics. (We’ll be publishing a separate post showing how to produce this visual within the next few days.)
Long-term-care data wrap-up: Tonight marks our final compilation of data at the Long-Term-Care COVID Tracker, and we’ve just published a look at the subset of long-term-care facility data available in the Centers for Medicare and Medicaid Services Nursing Home dataset. This federal dataset includes only nursing homes and accounts for about 27 percent of all COVID-19 deaths in the US to date. The long-term-care dataset we stitched together from state reports, by contrast, includes assisted-living facilities where states report them, and accounts for at least 35 percent of all US COVID-19 deaths.
Race and ethnicity data wrap-up: For 11 months, we have shown that the COVID-19 race and ethnicity data published by US states is patchy and incomplete—and that it nevertheless has indicated major inequities in the pandemic’s effects. Both of these things are true of the demographic data available from the CDC: much data is missing, and what data is reported shows ongoing disparities. Our introduction to the federal data will be posted later this week, and we’ll be publishing deeper analyses in the coming weeks.
Vaccines and variants
As we wind down our compilation efforts, the United States is at a critical moment in the pandemic: Decisive action now is our best chance at preventing a fourth surge in cases and outpacing the variants, which may be more transmissible than the original virus according to preliminary (preprint) data. Over the weekend, the FDA issued a third Emergency Use Authorization for a COVID-19 vaccine, this time for Janssen/Johnson & Johnson’s adenovirus vector vaccine, which showed impressive safety and efficacy results in its global clinical trials. The Biden administration announced on Tuesday that the US should have enough COVID-19 vaccine doses for every adult in the US by the end of May—a dramatic acceleration from previous timelines.
Meanwhile, concerns over an uptick in variants cases are growing in Florida after researchers noted that 25% of analyzed samples from Miami-Dade County’s Jackson Health public hospital were cases of B.1.1.7. Although partnerships between the CDC and other labs have increased the number of specimens sequenced from about 750 per week in December to seven to ten thousand per week in late February, this still allows for the sequencing of less than 3 percent of all cases in the United States.
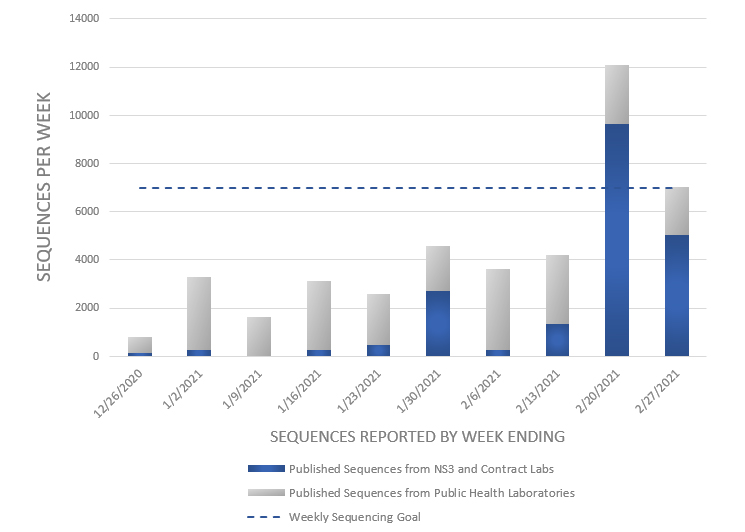
New York City has promised to quadruple the number of samples it sequences during the month of March, from 2,000 to 8,000 per week, which is more than the entire country’s labs sequenced in the week ending February 27.
Thank you for reading
Today’s weekly update is our 39th and last. We began writing them back in June 2020 as a way of offering a deeper interpretation of data points that was less jittery than those in the daily tweets. As we puzzled through the data and watched for indications of changing trends, we’ve tried to help people understand what has happened to us as the pandemic has ebbed and surged.
Although our data compilation will come to an end on Sunday, March 7, our work at The COVID Tracking Project will continue in other forms for another few months, as our teams complete their long-term analyses and wrap up documentation and archiving efforts. We’ll continue to post our work on the CTP site and link to it on Twitter until we finally close up shop in late spring.
Throughout the year that we’ve compiled this data, we’ve tried to explain not only what we think the data means, but how we came to our conclusions—and how we tested and challenged our own analyses. We hope that one result of our doing this work in public is that our readers feel better prepared to do the same for themselves and their communities.
The federal government is now publishing more and better COVID-19 data than ever before. Some gaps remain, but far fewer than at any previous moment in the pandemic. To those of you who’ve relied on our work this year, thank you for your trust. We’ve tried very hard to deserve it, and we believe that we’re leaving you in good hands.

Mandy Brown is editorial lead at The COVID Tracking Project. She previously served as VP of Product at Vox Media.

Artis Curiskis is outreach & reporting co-lead at the COVID Tracking Project and collaboratively runs the CTP special projects Long-Term Care COVID Tracker and City Data.

Alice Goldfarb leads The COVID Tracking Project’s part in The COVID Racial Data Tracker, and is a Nieman Visiting Fellow.

Erin Kissane is a co-founder of the COVID Tracking Project, and the project’s managing editor.

Alexis C. Madrigal is a staff writer at The Atlantic, a co-founder of the COVID Tracking Project, and the author of Powering the Dream: The History and Promise of Green Technology.

Kara Oehler is outreach & reporting co-lead at the COVID Tracking Project and collaboratively runs the CTP special projects Long-Term Care COVID Tracker and City Data.

Jessica Malaty Rivera has an MS in Emerging Infectious Diseases and is the Science Communication Lead at The COVID Tracking Project.

Peter Walker is Head of Marketing & Growth at PublicRelay and Data Viz Co-Lead at The COVID Tracking Project.
More Weekly Updates
Vaccines Begin to Arrive as Cases and Deaths Keep Rising: This Week in Long-Term Care COVID-19 Data, Dec 16
Cases are up and known deaths in long-term-care facilities are the highest they’ve been since late May.
Good News Despite Data Wobbles: This Week in COVID-19 Data, Feb 25
Cases, hospitalizations, and deaths are still declining, though holiday reporting and winter storms have probably caused fluctuations in several metrics. We reiterate that deaths reported each day don’t represent people who died that day—and they may even include deaths that occurred several months ago. And now is the time to switch over to federal data sources, because The COVID Tracking Project has only a little over a week of data compilation left.
More Good News: This Week in COVID-19 Data, Feb 18
Case numbers are dropping rapidly, and deaths are down 20 percent from last week. Vaccines are finally showing up in the data with dramatic declines in deaths from long-term-care facilities. We urge caution about interpreting wobbles in the data in the next week or two, given storm disruptions affecting Texas and elsewhere.