


This post was brought to you by Erin Kissane, Jessica Malaty Rivera, Joanna Pearlstein, Peter Walker, and Nadia Zonis.
Seven months into our work at The COVID Tracking Project, several significant patterns in the data we compile have become clear. As the third surge in US cases continues to accelerate, we’re writing a series of short posts to highlight and explain these stand-out patterns. Today, we look at the relationship between cases and hospitalizations.
Case counts—or the number of known infections—are the simplest way to track the spread of COVID-19 in a community, but they are an inexact measure. We know that many more people get infected than have their diagnosis confirmed by a lab test. We also know that the United States is identifying a much higher percentage of cases now than we did in the spring, when testing was all but nonexistent. And crucially, though you have to have infections to find cases, case numbers are affected by the availability and accessibility of tests.1 But we don’t have to look at case numbers alone. We also have months’ worth of data about how many people have been in the hospital with COVID-19. And the relationship that has emerged between cases and hospitalizations is clear: When COVID-19 cases go up, a rise in hospitalizations follows.
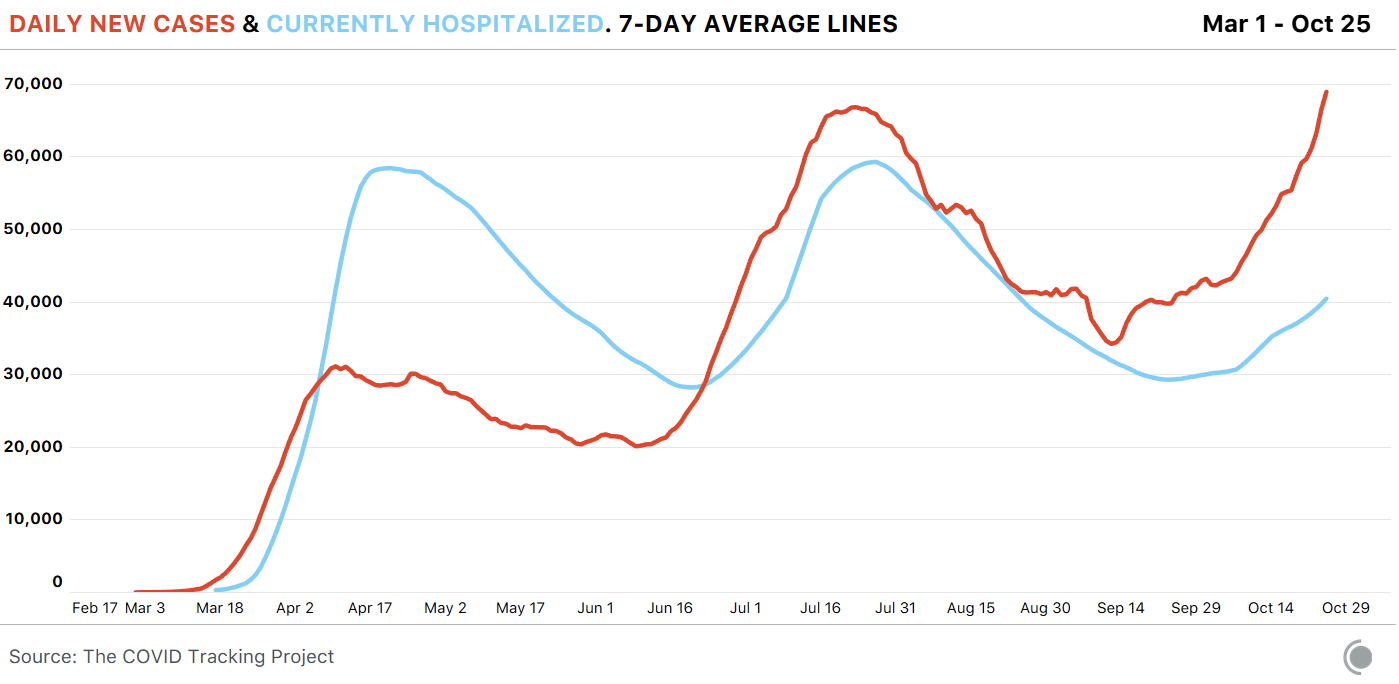
This was evident in the spring surge, though a lack of testing made the exact relationship between cases and hospitalizations more difficult to understand. The earliest cases and earliest hospitalizations were reported in lockstep, in part because tests were restricted to symptomatic—and in some areas of the country, to severely ill—patients, many of whom were tested upon their arrival at hospitals. The pattern of case rises leading to hospitalization increases held true in the Sunbelt surge this summer, and—so far—continues for the third surge currently burning through the Midwest and much of the rest of the United States.
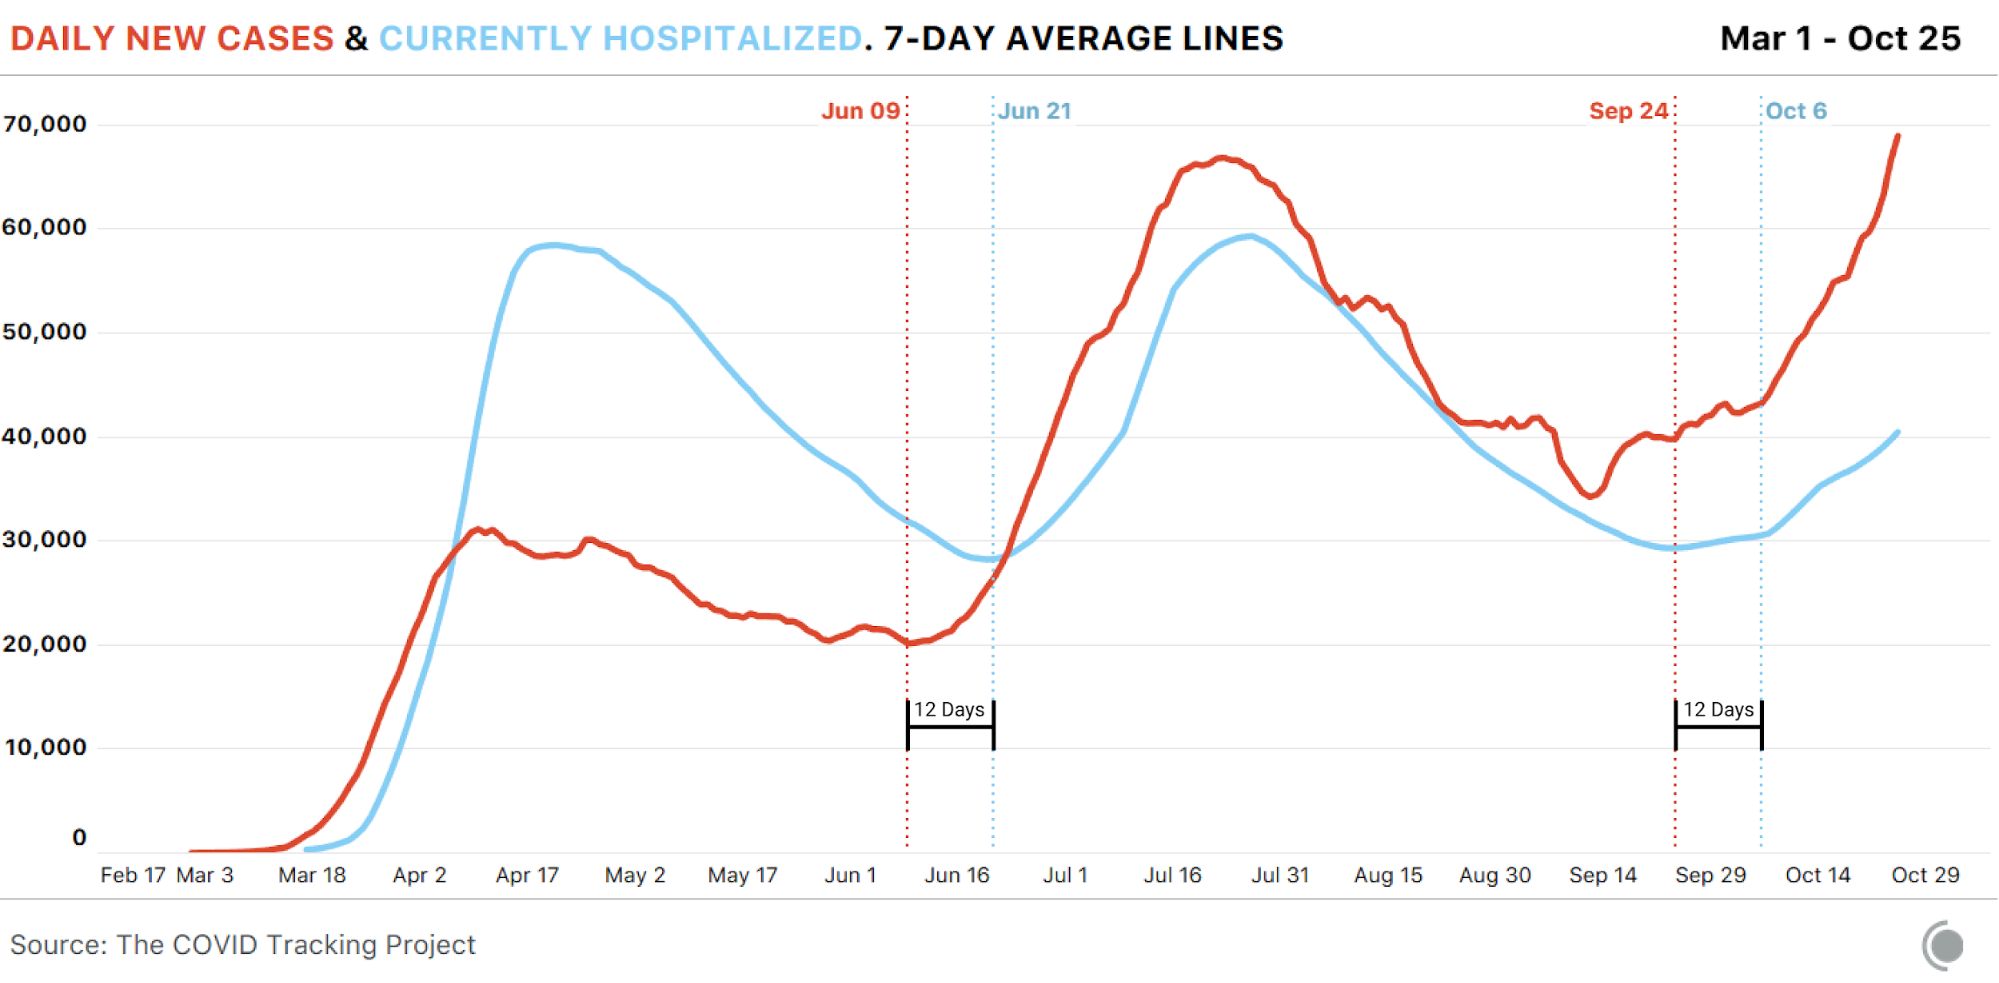
In the summer and fall, US testing capacity has been high enough for us to see cases spike in the data slightly less than two weeks before hospitalizations rise. In these periods, the number of days between the beginning of a sustained case rise and a clear increase in hospitalizations has remained remarkably consistent: about 12 days.2
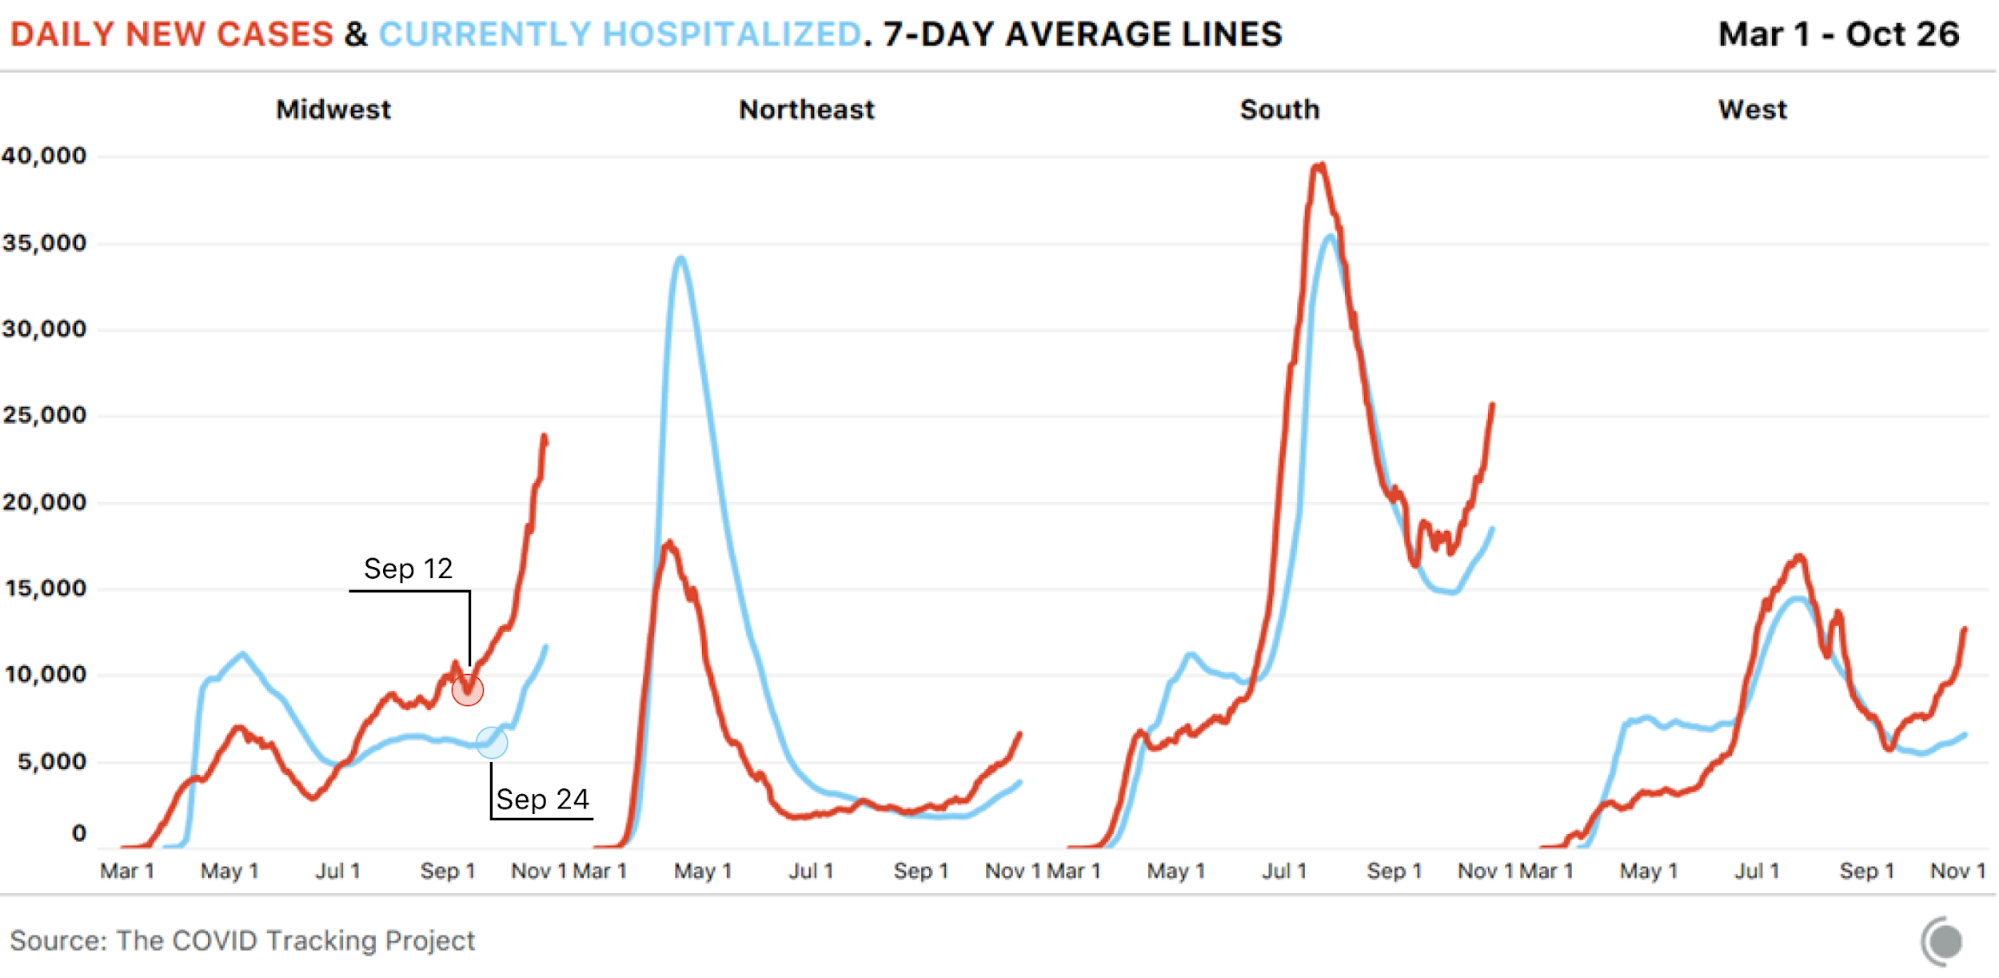
Outbreaks in the United States have until recently been highly concentrated in one or two regions, and the pattern of hospitalizations following cases up the curve has been true in every region. In the Midwest, where cases began spiking on September 12, the number of people hospitalized with COVID-19 began increasing sharply 12 days later and continues to grow rapidly. We would expect to see the same pattern in the many other areas now seeing cases rise.
The good news about COVID-19 hospitalizations
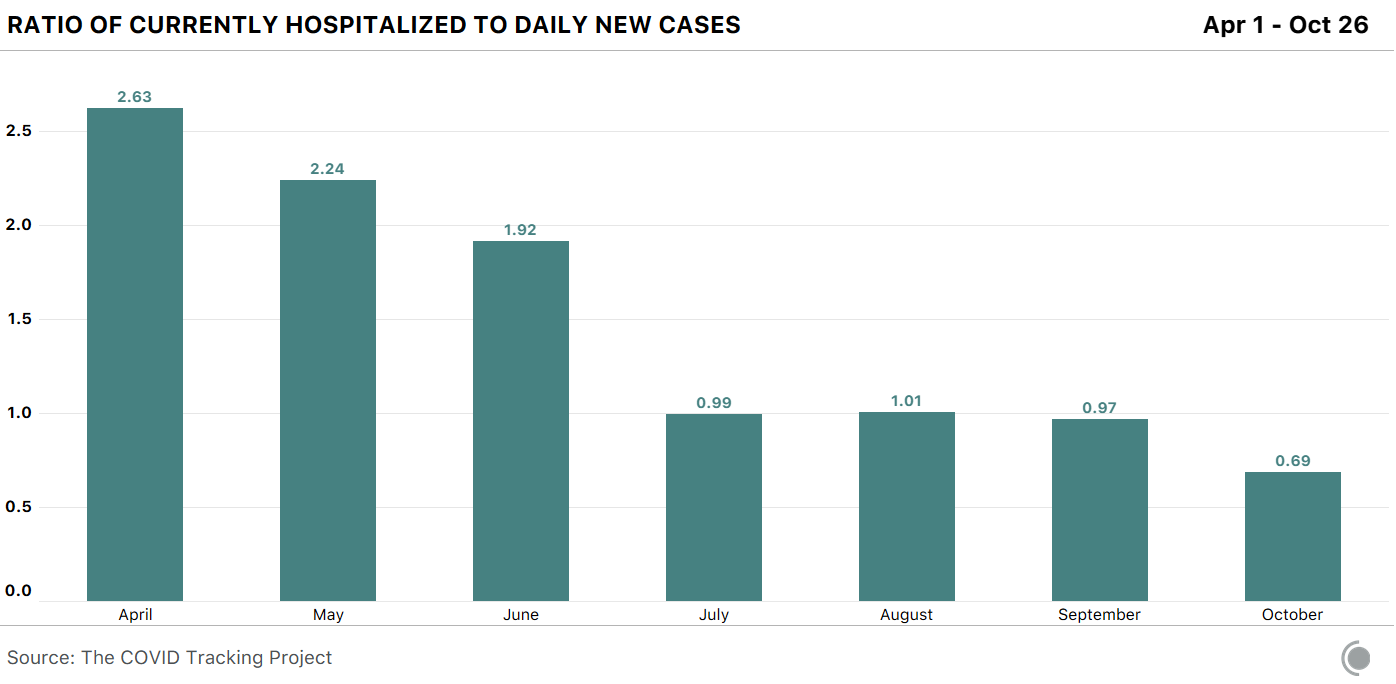
The good news in the case-hospital relationship is that now, far fewer people who are diagnosed with COVID-19 require hospitalization. In April, there were 2.6 people hospitalized with COVID-19 for each daily new case, on average. In October, that is down to 0.69 people.
This is a very welcome change, and we’re probably seeing it for a few reasons, including:
Greatly expanded testing capacity, which means we are now able to identify more asymptomatic and mild cases, fewer of whom will need to be admitted to a hospital.
Early detection of cases (due to expanded testing) allowing for rapid mitigation efforts and interventions has both prevented some hospitalizations and shortened hospital stays.
Increased testing of younger people, including college students, who are at less risk of severe disease—though not less likely to transmit the virus.
Importantly, this change in the hospitalization ratio doesn’t mean that COVID-19 itself has become less dangerous, especially—but not only—to people with pre-existing conditions and to those in older age groups. People aged 65-74 years are five times more likely to require hospitalization than those in the 18-29 age bracket. Those aged 75-84 years are eight times more likely to require hospitalization, and those over the age of 85 are thirteen times more likely to require hospitalization. If, as we have seen before, the virus is transmitted from younger populations to older populations, we would expect the hospitalization ratio to rise again, particularly in areas with severe outbreaks.
It’s (still) not just testing
If expanded testing were the main force behind case rises, we would expect to see testing and case increases rise together. That is not what we’re seeing: Since October 1, the seven-day average for new cases has risen 61 percent, while tests are only up 14 percent in the same period. Meanwhile, the number of patients currently hospitalized with COVID-19 has risen 40 percent in October thus far. Case growth has always mattered, and when cases rise, hospitalizations invariably follow.
Later this week, we’ll break down what we know about the relationship between COVID-19 hospitalizations and deaths, including the rise in deaths we expect to see based on current hospitalization figures. We’ll also look at some of the best news of the pandemic to date, which is that far fewer people who are hospitalized are dying.
1 An accurate measure of test positivity would help us understand more about the relationship between testing and disease prevalence in specific areas, but as we’ve noted, data inconsistencies make it impossible to calculate truly comparable test positivity rates for US states and territories.
2 This roughly mirrors what we know about the clinical progression of COVID-19. For example, the US Centers for Disease Control and Prevention found that the median time from the onset of illness or symptoms to ICU admission ranged from 10 to 12 days. ICU admissions capture more severe illness than do measures of all inpatient admissions, and symptom onset doesn’t necessarily coincide with the date a case is diagnosed or reported. But statistics like these help explain the timing between case surges and hospitalization increases.

The COVID Tracking Project is a volunteer organization launched from The Atlantic and dedicated to collecting and publishing the data required to understand the COVID-19 outbreak in the United States.
More “Testing Data” posts
How Probable Cases Changed Through the COVID-19 Pandemic
When analyzing COVID-19 data, confirmed case counts are obvious to study. But don’t overlook probable cases—and the varying, evolving ways that states have defined them.
20,000 Hours of Data Entry: Why We Didn’t Automate Our Data Collection
Looking back on a year of collecting COVID-19 data, here’s a summary of the tools we automated to make our data entry smoother and why we ultimately relied on manual data collection.

A Wrap-Up: The Five Major Metrics of COVID-19 Data
As The COVID Tracking Project comes to a close, here’s a summary of how states reported data on the five major COVID-19 metrics we tracked—tests, cases, deaths, hospitalizations, and recoveries—and how reporting complexities shaped the data.

